Effects of HUD Information Location on Drivers' Cognitive and EEG Responses
Purpose: Investigates the effect of HUD information location on cognitive processing.
Methods: Driving simulation experiment with a within-subject design (4 HUD locations), using Stroop and Flanker tasks with multimodal measures (EEG, performance, self-report)
Key Finding: Efficiency ranking (Bottom-Left > Bottom-Right > Top-Left > Top-Right)
Background
Driving Requires Continuous Attention
Drivers must constantly perceive and respond under limited cognitive resources
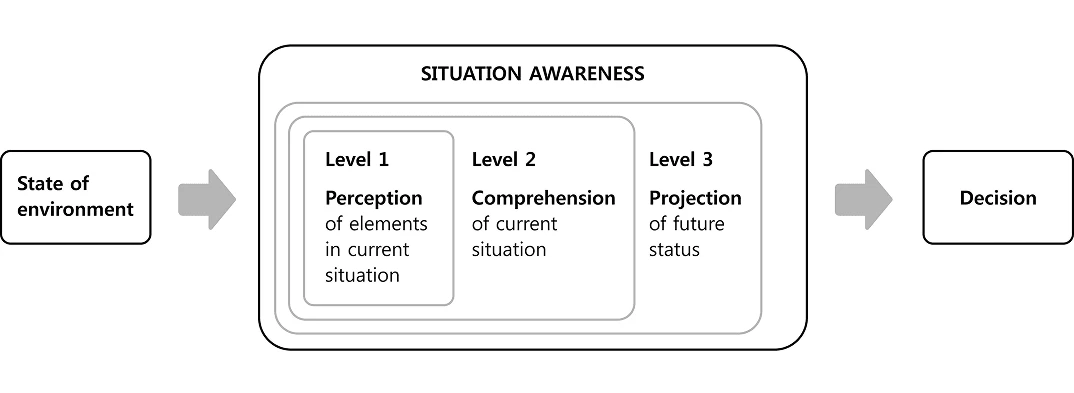
Fig. 1. Situation Awareness Theory
HUD Increases Attention Competition
HUD information competes with real-world driving information
Fig. 2. Driver–Vehicle–Environment System with HUD information
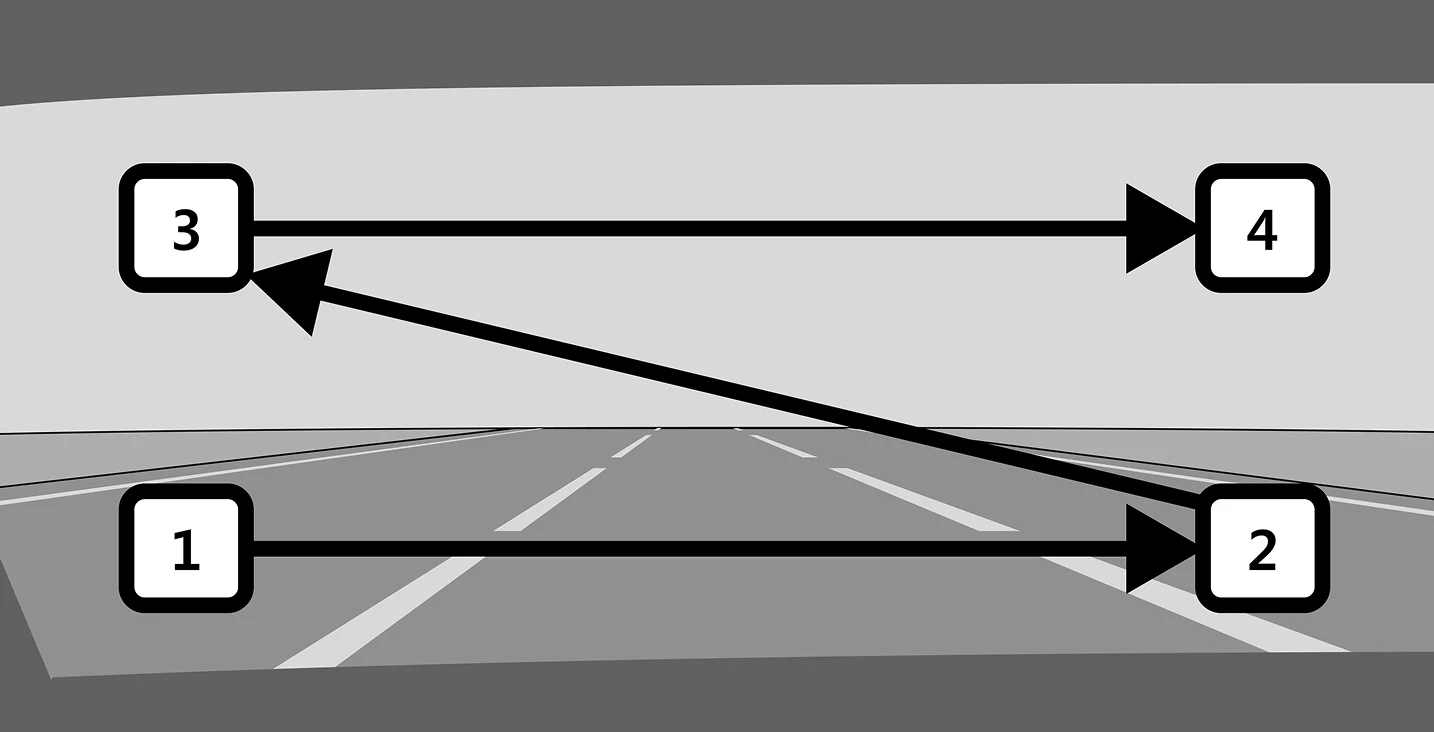
Central Vision is Used for Safety
Information is placed in central vision to reduce eye movement and ensure faster response (Foveal vision & overt attention)
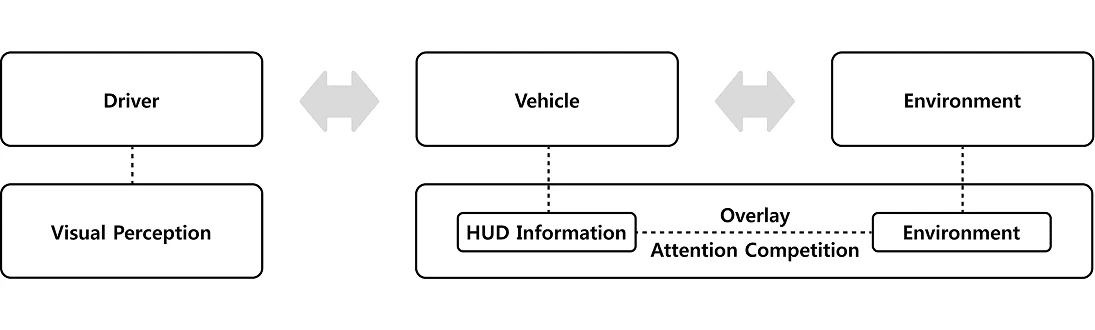
Fig. 3. Field-of-View Angles (13°, 30°, 60°, 107°)
Motivation
Issues
- Increasing information load due to infotainment and NDRTs
- AR-HUD introduces dynamic visual cues that require central attention
- Centralized information increases the risk of cognitive tunneling
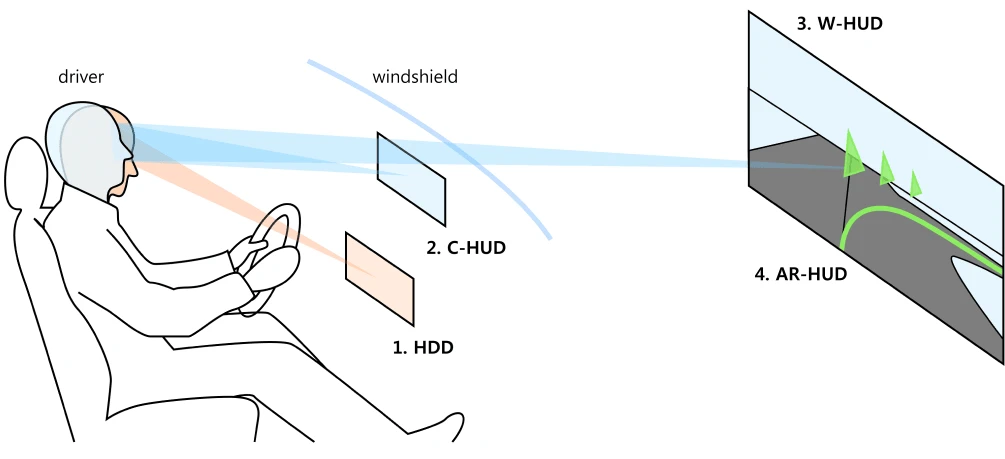
Fig. 4. AR-HUD Requires Central Attention
Source: YouTube (Mercedes-Benz AR Navigation HUD)
Limitations
- Central Vision is Overused in HUD Design
- Peripheral Vision is Underutilized
- Cognitive Processing Varies Across Visual Areas
- Optimal Peripheral Location Remains Unclear
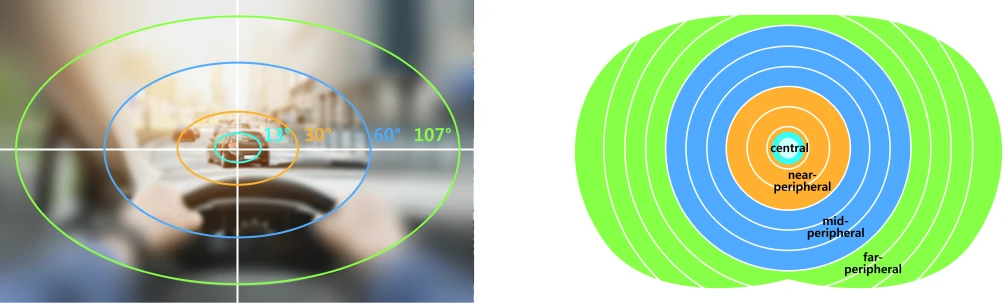
Fig. 5. Low-Utilization Areas in HUD Layout
"Static information should be placed in the periphery, while critical information should be kept in central vision."
Goal
" Which peripheral HUD location is the most efficient?"
" Identify the optimal peripheral HUD location based on cognitive performance "
Method
- Independent variable: HUD location (4 positions: Top-Left, Top-Right, Bottom-Left, Bottom-Right)
- Design: within-subject, randomized trials
- Two experiments: Stroop (80 trials), Flanker (80 trials)
- Measures: performance, self-report, EEG
- Participants: 18
Setup
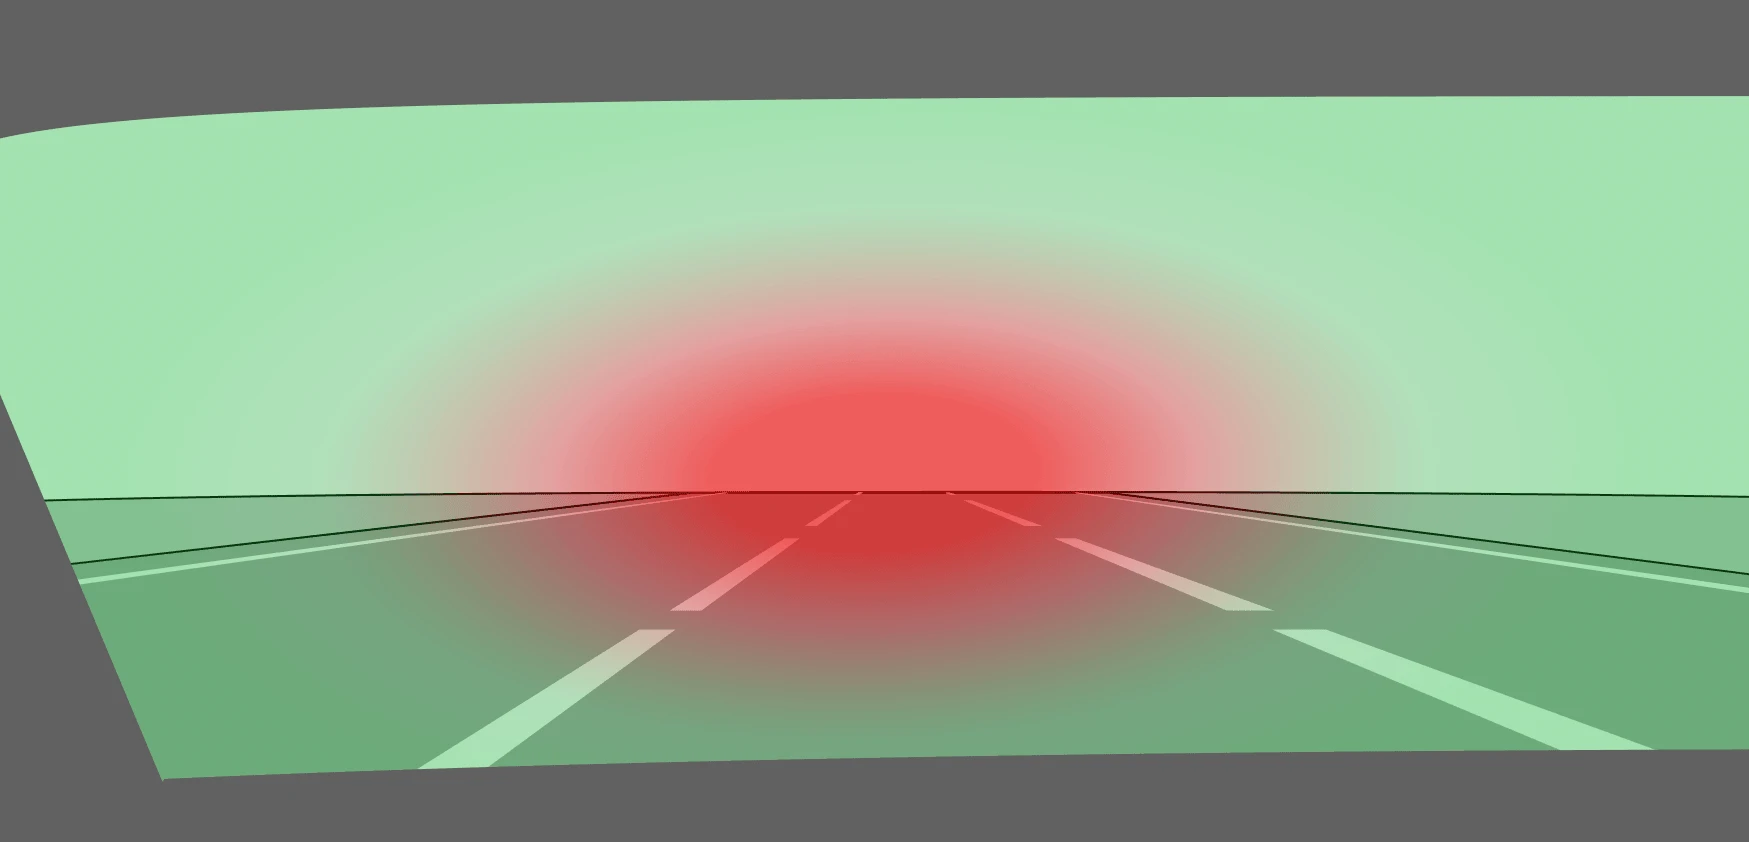
Fig. 6. Experimental Setup
Task
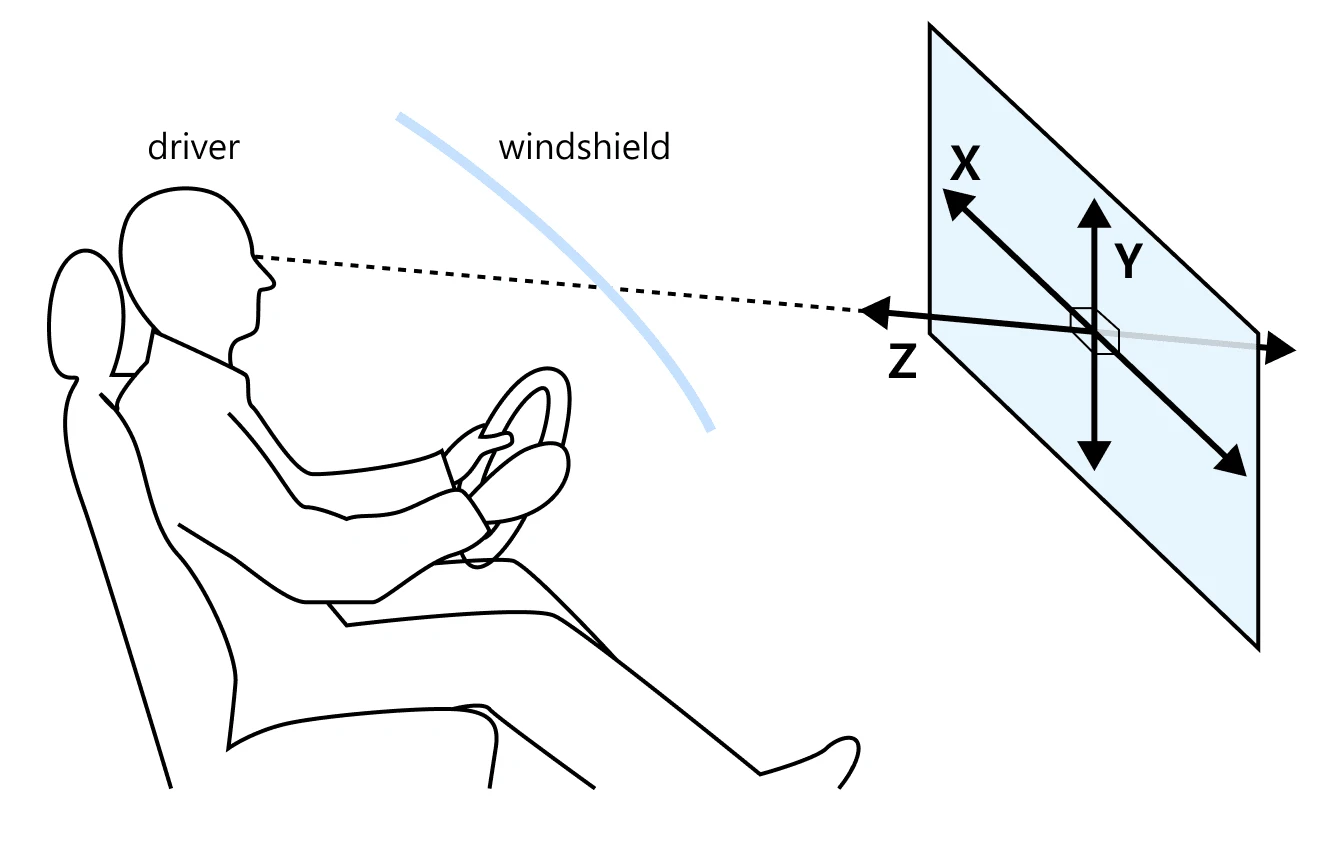
Fig. 7. Task (Congruent vs. Incongruent)
Stimuli
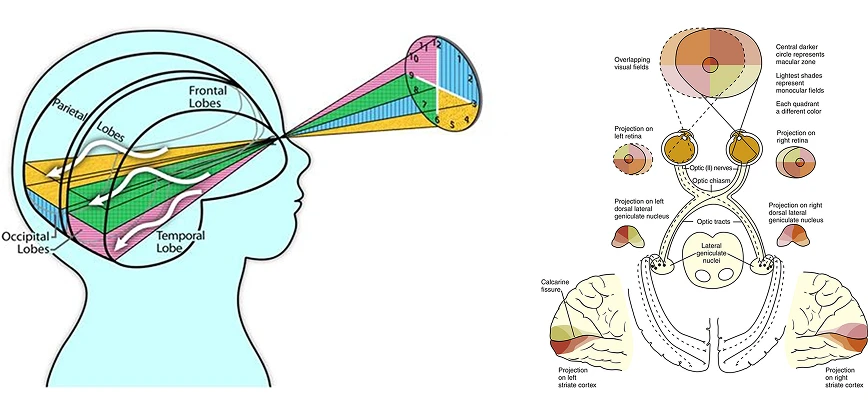
Fig. 8. Stimuli (Stroop and Flanker)
Experimental Procedure
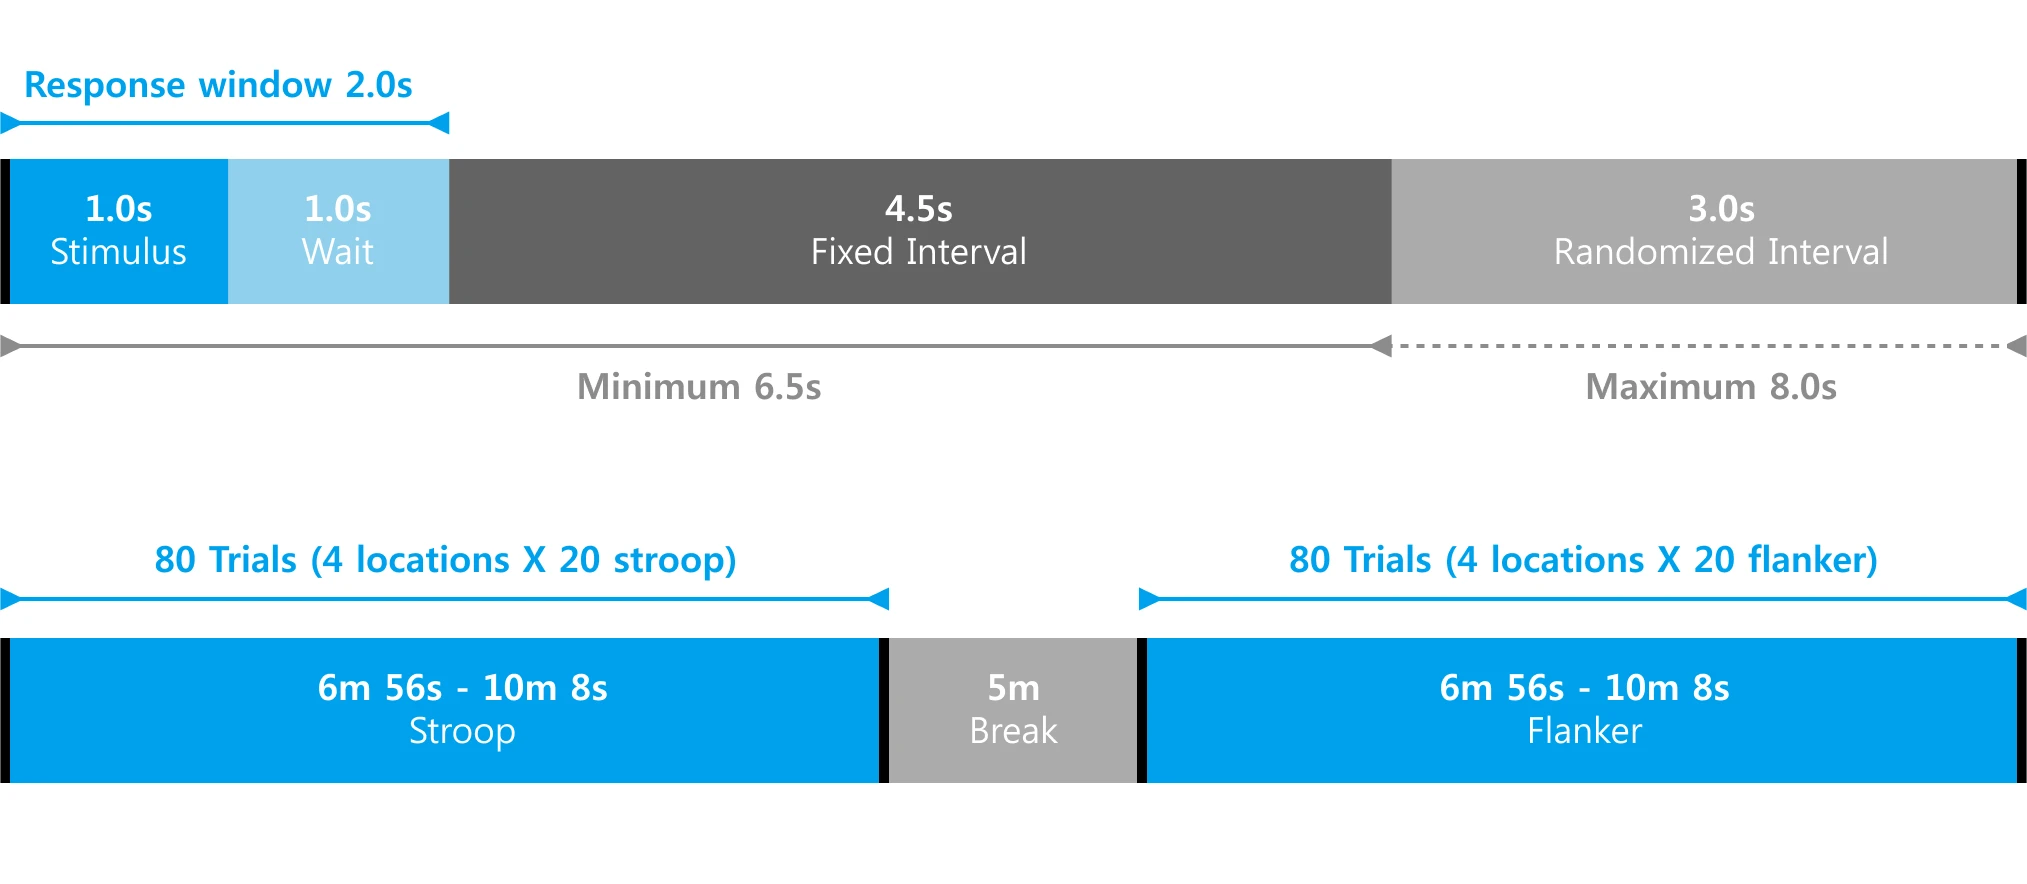
Fig. 9. Experimental Procedure
Multi-level Cognitive Response Measurement
- EEG Response (Cognitive Processing Stage): Event-Related Potential (ERP; P1, N1, P2, N2, P3b), Power Spectral Density (PSD; Laterality Index, LI)
- Performance Metrics (Behavioral Outcomes): Accuracy, Reaction Time (RT), Inverse Efficiency Score (IES), Signal Detection Theory (SDT) metrics, No-response rate
- Self-Reported Metrics (Subjective Experience): Fast Motion Sickness (FMS), Mental Effort Rating Scale (MERS), Expectation–Experience Rating
Analysis
- Statistical Analysis: Differences across conditions
- Post-hoc Analysis: Pairwise differences
- Integrated Analysis: Multimodal integration
Result
" The Bottom-Left location enhanced early visual processing, improving performance and reducing cognitive burden "
EEG Response
- Bottom-Left: Early-stage visual processing (P1) ⬆︎
- Top-Right: Cognitive demand (N1/N2) ⬆︎
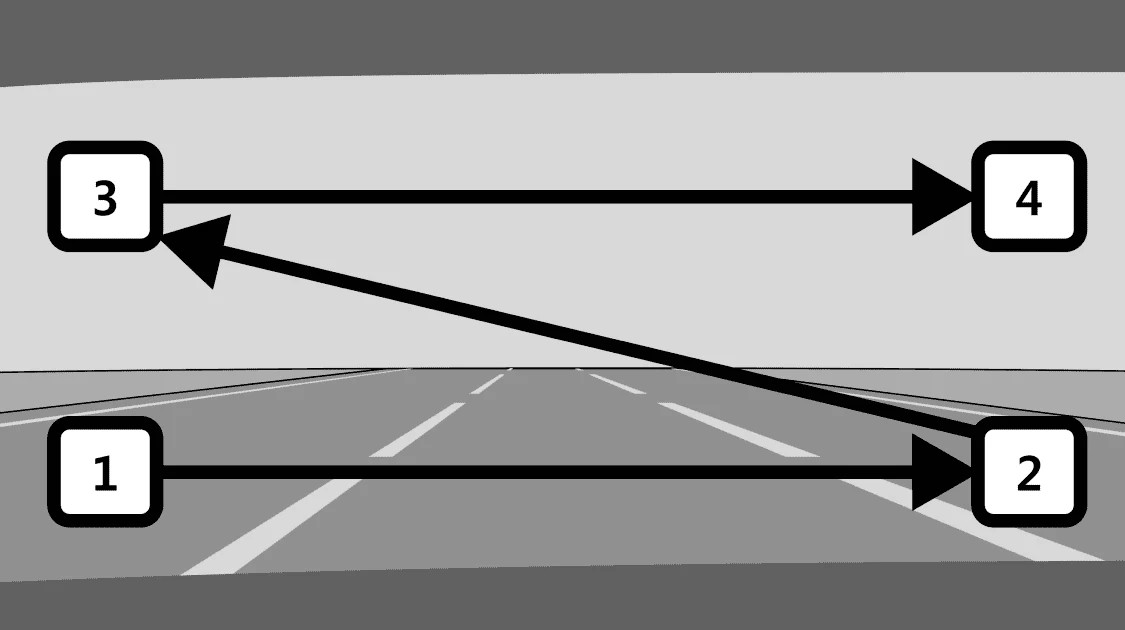
Fig. 10. Bar Plot of P1 Peak by HUD Information Location
Performance Metrics
- Bottom-Left: Fastest response, Highest Accuracy
- Top-Right: Slowest response, Lower Accuracy
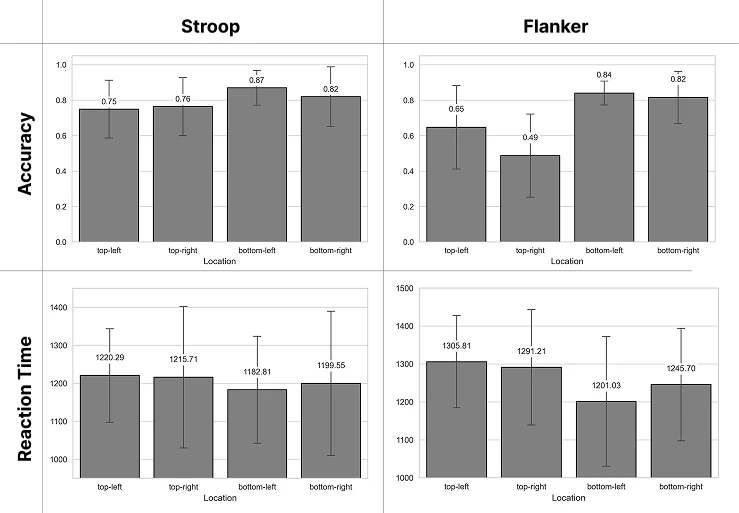
Fig. 11. Bar Plots of Accuracy and Reaction Time by HUD Information Location
Self-reported Metrics
- Top-Right: Higher perceived effort
- Bottom locations: Lower cognitive burden
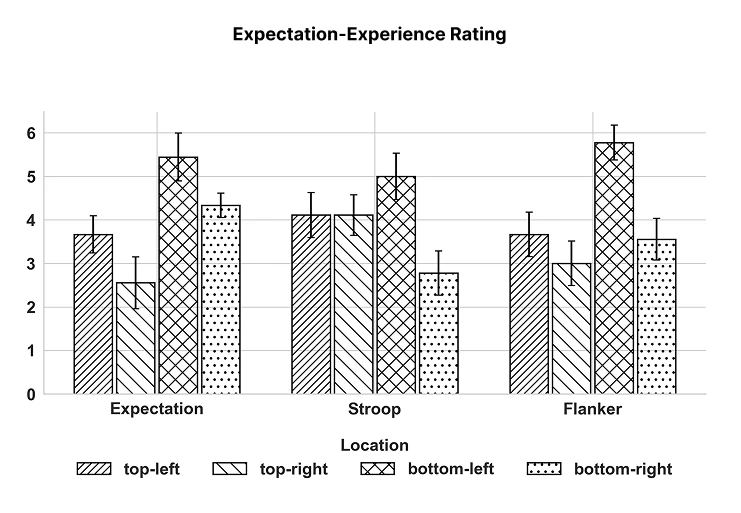
Fig. 12. Bar Plot of Expectation–Experience Rating by HUD Information Location
Conclusion
Efficiency ranking:
Bottom-Left > Bottom-Right > Top-Left > Top-Right